This wide- and large- screen layout
may not work quite right without Javascript.
Maybe enable Javascript, then try again.
Town of Ipswich
PropertyTaxes
Are Ipswich's local property taxes "high" or "low"? The answer depends on when you compare them and what you compare them to. Ipswich local property taxes rose significantly in 2002 and 2003 because of the town's Open Space program. One useful comparison is with past years. A second useful comparison is with other towns.
Impact of Open Space Program on Ipswich Taxes
Ipswich's property taxes rose significantly in 2002 and 2003 because of the town's Open Space program. The following, which appeared in our Ipswich Chronicle newspaper as a letter to the editor in May 2002, describes the program and its tax impact in detail.
It's striking how many great views there are in Ipswich. We can look out over vast expanses of undeveloped field or marsh. Our open spaces are quite unusual and make Ipswich unique, something we as residents tend to forget.
The Trustees of Reservations, the Essex County Greenbelt Association, the Audubon Society, and the State of Massachusetts all protect nearby parcels of land. But they can't do everything.
Recognizing this, Ipswich residents chose to do their part too by passing the ten million dollar Open Space Bond at both the town meeting and the ballot box two years ago. The Open Space Bond came up at the same town meeting that supported the new town hall and discussed the building cap. That was the last town meeting at the old Whipple Middle School. The crowd, the largest I remember up until that time (the first night of town meeting this year was even bigger), had to be split with the overflow going to the cafeteria downstairs because the gymnasium was already packed.
Although some trepidation was voiced because the amount of money was so large, ultimately the Open Space Bond proposal comfortably exceeded the required 2/3 majority with 369 voting in favor and 149 voting against. The Ipswich Chronicle recognized the significance of this vote with the front page headline "Town meeting ready to pay tariff for open space." Then at the following ballot election, the Open Space Bond passed by a wide margin with 1,403 for and 876 against.
The primary purpose of the Open Space Bond is to protect land from development and so preserve our vistas. (Secondary things mentioned in the article are water supply protection, recreation, and general municipal purposes.) Of course preserving vistas by circumscribing development may also incidentally protect habitat and wildlife.
One of the problems the town faced previously when properties became available for purchase or conservation restriction was the need to take every single proposal to a town meeting separately. We never saw just how much town meeting time this could use up, because almost all sellers decided the next town meeting was "too long to wait" and excluded the town from their offer. The Open Space Bond gives our Selectmen authority without going back to town meeting every time to borrow bit by bit up to a total of ten million dollars, then pay off the loans primarily with increased taxes that are treated as a "debt exclusion" by Prop 2½. So far slightly less than half the money has been borrowed and expended. The remaining more than half the authorized money hasn't even been borrowed yet. After taking a while to get rolling, the Open Space Bond has now been used for the Willowdale, Scott Farm, Wendel, Smolenski, and Ross projects. The costs of these have only recently appeared in our tax bills.
After the initial Open Space Bond proposal was accepted, it became clear the voters don't just want to just see vistas, they want to be able to actually walk over their land. Although no further formal vote has occurred, the Selectmen recognized this and shifted course a little to accommodate it. The best example of this is that after a couple years of wrangling and hard work, the final deal for the Wendell property includes public access.
It's perhaps unfortunate that a decision was made two years ago in excellent economic times while the bill is coming due now in poor economic times. If the Open Space Bond, the new town hall, a municipal override, and a school override had all gone to the voters at the same time, the town might have prioritized them differently. Perhaps the Selectmen could "go slow" for the next year or two on using the rest of the Open Space Bond authorization. But that wouldn't undo the borrowing that's already occurred. And it might not work for new projects either, as parcels which normally wouldn't come up for sale may be forced onto the market by economic distress.
Retaining our vistas was a good idea a couple years ago when the town embarked on the Open Space Bond as one way to help do that. Retaining our vistas is still a good idea.
Because of poor economic times there was an informal cutback (or even moratorium) on use of Ipswich's remaining Open Space Bond authority for several years in the aughts.
Ipswich Taxes Compared With Past Years
This comparison of taxes in Ipswich is with past years. The 1990 and 2000 numbers do not include the effect of the Open Space program as it had not been started yet. Another useful comparison of taxes in Ipswich is with other towns.
Keep in mind tax bills can appear quite differently to people of different ages because the value of the dollar has changed dramatically over time. This is especially true of our senior citizens who have seen prices rise more than five times since they were young adults.
Of most interest is changes through time in where our money goes. Another comparison is our static wealth (property) versus our dynamic wealth (income) and how it's changed through time.
These comparisons, like those in the following section comparing different towns, are based on data mainly from the Commonwealth of Massachusetts Department of Revenue-Division of Local Services municipal data bank, and also in some cases data directly from the U.S. Census.
Some data was readily available back only to the mid '80s, and the income data was available only from the U.S. Census for 1990 and 2000 (that income data is actually from 1989 and 1999). For the more recent part of the graph, income data was not readily available from the U.S. Census at all, so a number called "DOR Income" from the Commonwealth of Massachusetts was used instead. Even that number is only readily available retroactively several years later. So the most recent part of the graph uses 2008 data, which was the latest readily available complete set of data when the graph was revised near the end of 2011.
Where Our Money Goes
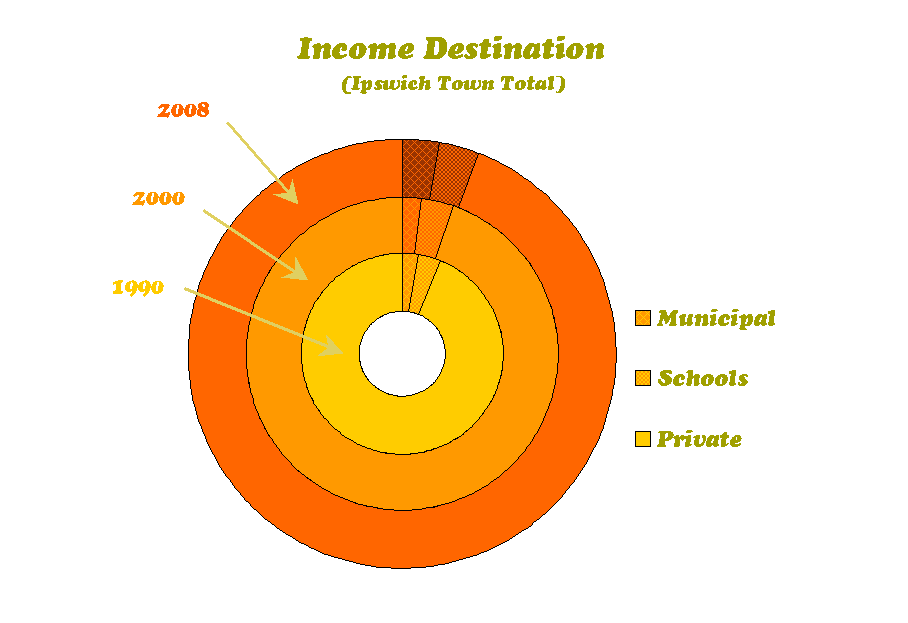
The doughnut chart (multiple pie chart) below compares what percentage of our income we spend on our schools, what percentage of our income we spend on other town functions, and what percentage of our income we do not pay in local taxes. Although we actually pay local taxes based on our property value rather than our income, this simulated comparison of local property taxes to income may be more enlightening.
Compared to our income, the amount we spend on our schools and the amount we spend on other town functions haven't changed a whole lot over the decades.
Static vs. Dynamic Wealth
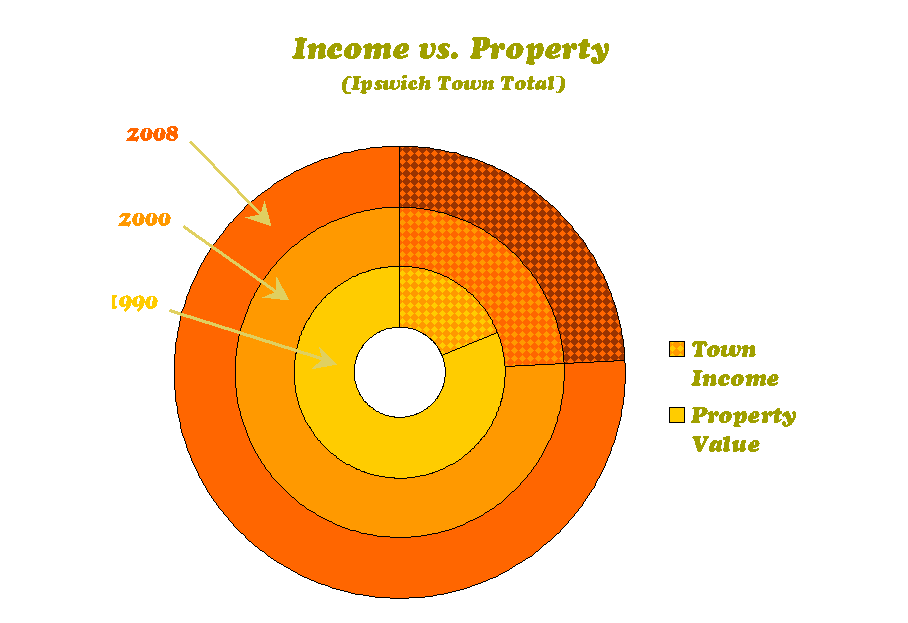
The above simulated comparison matches our local expenditures to our income although local taxes are actually assessed on property value. The obvious next question is how our income (dynamic wealth) compares to our property value (static wealth). Here's a comparison in dollars of our income to our property value, both for the most recent census and a decade before that.
In 1990 it would have taken about four years of our income to buy all our property. Our income became more important over the decade, so in 2000 and 2008 only about three times our yearly income would buy all our property.
Ipswich Taxes Compared With Other Towns
This comparison of taxes in Ipswich is with other towns. Another useful comparison of taxes in Ipswich is with past years.
These comparisons are all done using the mythical "Average Single Family Tax Bill" spreadsheet calculated by the state Department of Revenue-Division of Local Services and published as one of their DOR-DLS municipal spreadsheets. This number is generated by identifying all the non-commercial non-multifamily tax parcels in a town, calculating the average value of one such parcel, then producing the yearly tax bill on that valuation in that town.
I compare Ipswich local property taxes to four different groups of towns. Ipswich is definitely higher than many Resort, Retirement & Artistic communities, and on the high side of all communities in the entire state. It's just a little lower than the average of all communities in the eastern part of the state (not including Cape Cod and the Islands). Note that a few communities have very high taxes so both the eastern graph and the statewide graph extend quite far to the right. And Ipswich is definitely lower than many nearby communities.
| Property Taxes For ... | Average Single Family Tax Bill (2011) |
|---|---|
| All "Resort, Retirement & Artistic" Communities (?more...) | $3,712 |
| All Communities in Entire State (?more...) | $4,455 |
| Ipswich | $5,357 |
| Communities in Eastern Part of State (?more...) | $5,554 |
| Nearby Communities (?more...) | $6,128 |
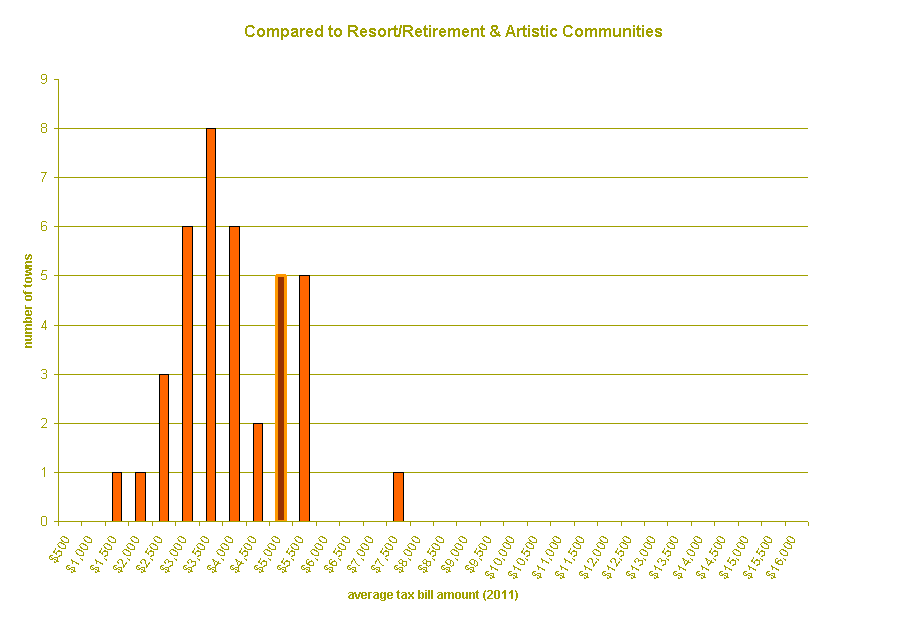
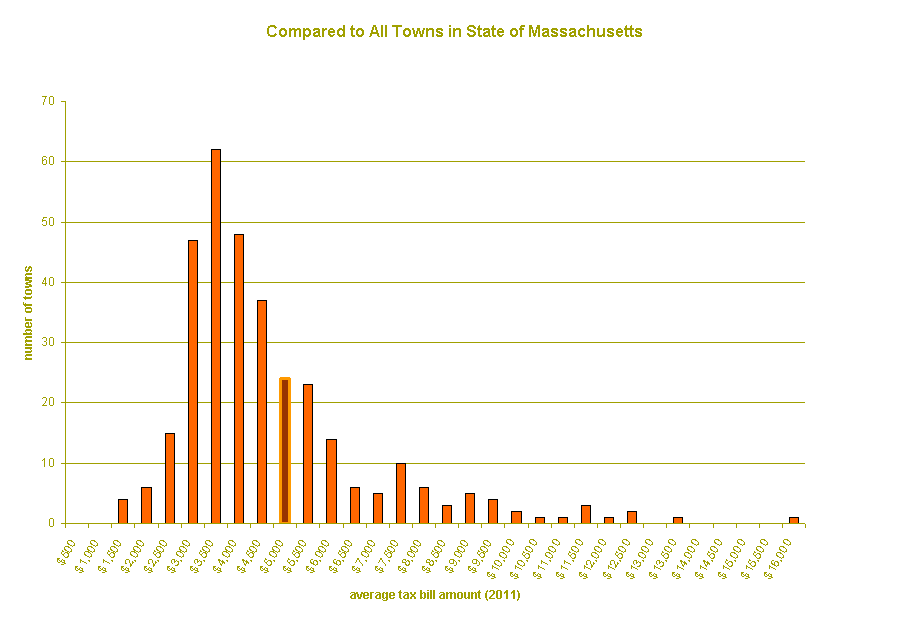
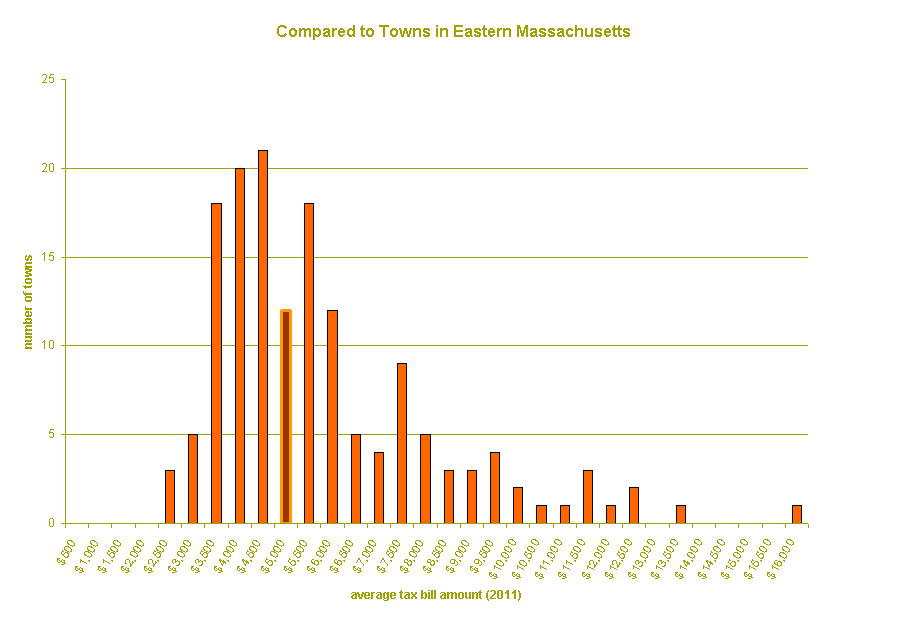
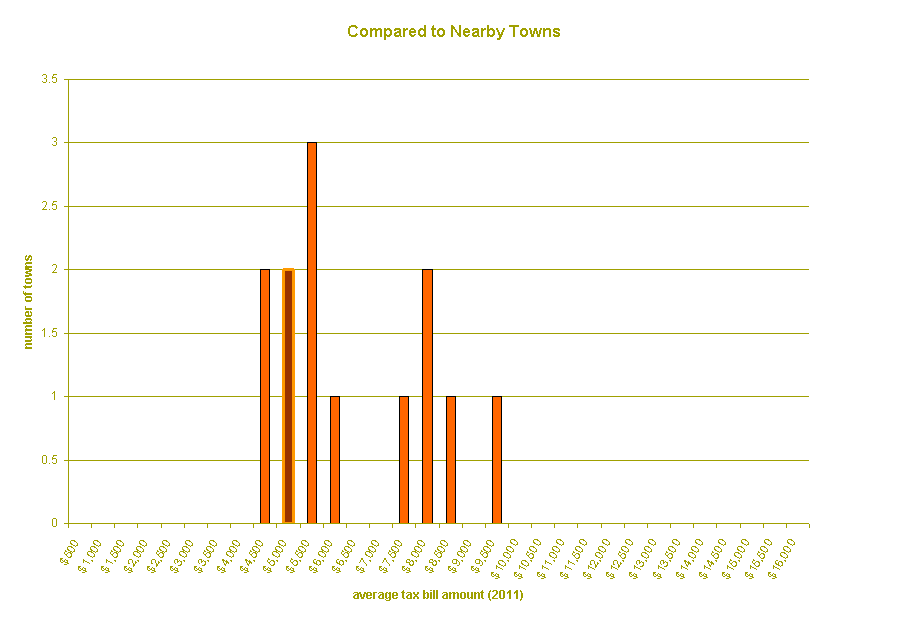
All four graphs below are histograms with the horizontal axis showing the average single family tax bill in buckets ($500 or $1000 wide) and the vertical axis showing the number of towns in each bucket. The number of towns legend on the vertical axis is large for the graphs that compare many towns and small for the graphs that compare relatively fewer towns.
All the buckets are the same size and all the graphs show the same buckets (even empty ones) in the same positions, so the graphs be compared easily and accurately. Even smaller buckets would have put almost every single town in its own separate bar, and even larger buckets would have averaged out so much detail it wouldn't be possible to see if the bar containing Ipswich was toward the lower side or the higher side. A tall bar says several towns all have about that same tax bill, and a short bar says only a few towns have similar tax bills. Most of the bars are orange. The one bar in each graph that has a darker colored center and lighter colored edges is the bar that includes the Town of Ipswich.
Resort, Retirement and Artistic Communities
In the early 80's the state Department of Education classified all Massachusetts towns into one of seven groups. This classification scheme was called Kind of Community. The last classification done by DOE is still usable, even though it's nearly thirty years out of date and almost certainly misleading.
Ipswich was put in the Resort/Retirement and Artistic group. Although this classification may no longer be accurate today, it's nevertheless interesting to compare Ipswich property taxes with all the other towns that were classified as Resort/Retirement and Artistic back in 1985. The following graph does exactly that, comparing Ipswich property taxes to the other forty Resort/Retirement and Artistic towns. In this comparison Ipswich property taxes (Ipswich is included in the darker bar) are higher than many in this group.
Massachusetts Statewide Communities
The graph below compares local property taxes in Ipswich with all other towns in the whole state of Massachusetts. Ipswich property taxes (Ipswich is included in the darker bar) are on the high side of the largest clumps of towns statewide. Note that a few towns in the state have very high property taxes so bars continue far to the right on the graph.
Eastern Massachusetts Communities
This graph compares Ipswich property taxes with other towns in just eastern Massachusetts rather than the whole state. For this graph Eastern Massachusetts is defined as all towns in Bristol, Plymouth, Norfolk, Suffolk, Middlesex, and Essex counties. Excluded are Cape and Islands (Barnstable, Dukes, and Nantucket counties), Central Massachusetts (Hampden and Worcester counties), and Western Massachusetts (Berkshire, Franklin, and Hampshire counties).
This is perhaps a better comparison than with the entire state since different parts of Massachusetts are so different. Ipswich property taxes (Ipswich is included in the darker bar) fall pretty much in the middle of this group of communities. Note that as with the previous graph a few towns have very high property taxes so bars continue far to the right on this graph.
Nearby Communities
For this graph communities near Ipswich are taken to be Danvers, Peabody, Hamilton, Wenham, Essex, Gloucester, Boxford, Topsfield, Rowley, Georgetown, Newbury, and Newburyport. That's all the towns between Ipswich and the Atlantic Ocean, all the towns immediately adjoining Ipswich, and all the towns a little further north or south.
Compared to these towns Ipswich (included in the darker bar) is clearly toward the left of the bars signifying it has a low tax rate. As one resident expressed it "why would I want to live in Topsfield?"
 Chuck Kollars' other web presences include